Streamline Your Workflow with Flexible Data Views

The features described here are new or updated as of this post’s publish date. Look for more recent Product Feature Update articles.
Customization is an integral part of the vision for udu Source. The ability to structure your data in a way that makes sense for your workflow is just one of the reasons udu Source is so user friendly. This post will guide you through getting your table view set up exactly the way that works for you.
Starring & Deleting
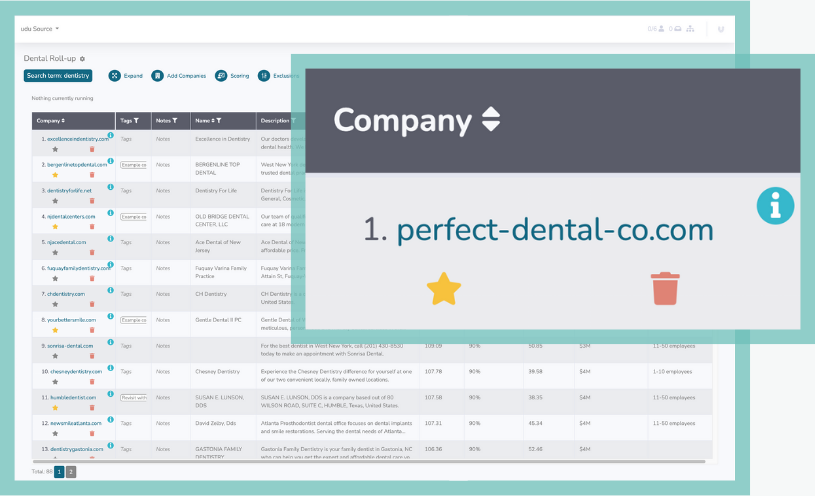
First off, and most importantly, you have the ability to “star” good companies and delete bad ones. Not only does this allow you to keep your table a little cleaner by getting rid of companies you’re not interested in, but it is the foundation of how the machine learning in udu Source works. By showing the system what a good match and a bad match look like, udu Source is then able to start determining more accurately which companies you’ll be interested in seeing at the top of your list.
Adding Columns
By default, udu Source gathers a large amount of data about each potential target that shows up in your list. For example: estimated revenue, estimated employee count, funding information, social media handles, etc. In addition to this default data, there is also the ability to add many more columns of data to the table based on what data points you find relevant. Click “Customize table” to see a long list of data types that are available to view. Some data categories have column names with checkboxes next to them. For these, udu Source has already gathered the data and you can just click the checkbox to turn these columns on once you click “Save”.
For the categories toward the bottom such as “Employee contacts”, “Target phrases” and “Externally linked urls”, click the “+” link to add those columns. Then click “Save” to return to your table view. You’ll see that the “Update” button is now visible. This is because udu Source needs to go back and analyze all of the companies to gather this new type of data to populate the column.
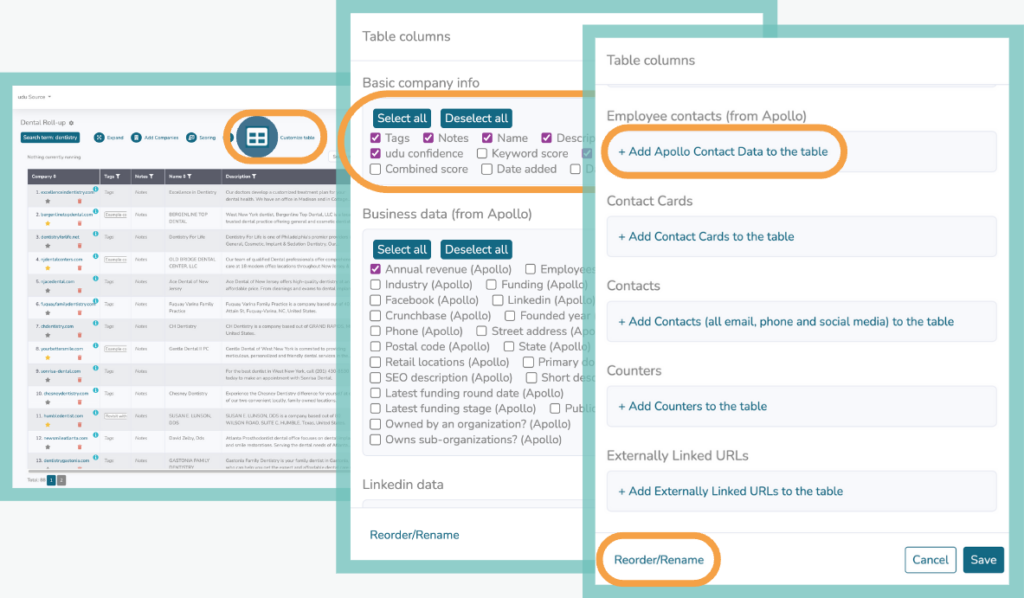
Additionally, click “Reorder/Rename” to customize the order and names of columns in your table.
Reordering & Renaming Columns
For your particular workflow, the default names and order of columns may not be optimal. udu Source allows you to change this to fit best with your workflow. Click “Customize table” and then, in the lower left corner, click “Reorder/Rename” (see image above). You can put the columns in any order you like and name them anything.
Sorting
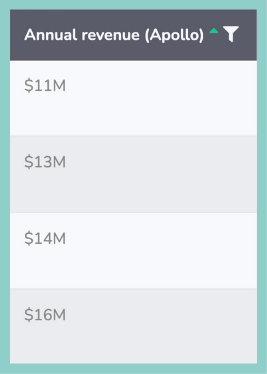
By default, your table will be sorted by “udu score” which is a proprietary scoring model that uses machine learning to try and rank companies in order of their likelihood to be a good target. At some point during your project, it may make sense for you to sort by some other column. For instance, if you’ve got your table narrowed down to just good targets and you are interested in looking at all of the smaller companies first, sorting by revenue in ascending order would be one way to do that. To change the sort order, just click the up/down arrow icon in the header of each column.
Filtering
Filtering is very valuable to narrow down your table to the absolute best targets, whether it be filtering to verify that a company mentions a specific key phrase on their homepage, by minimum revenue, maximum employees or just about anything you can think of. To add filters, just click the funnel icon in a column’s header (see image below).
Tags
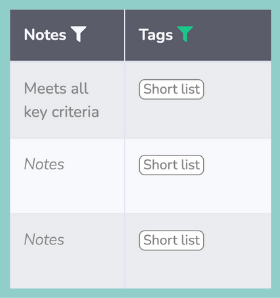
Add tags or notes by clicking in the Tag or Notes field in a company’s row.
Tags are a great way to organize your table. You’ll notice that some companies in the table already have some tags that udu Source has provided. For instance, any example company that you provide at the beginning of the project will be tagged as “Example company”. Additionally, any company that you manually add later in the process by clicking “Add companies” will also have a tag that you determine when adding those companies (read more about how to use the “Add companies” feature). A couple of workflow approaches that are popular with customers are tagging companies that need more in-depth review and/or tagging companies that you are certain you want on your short list. This way, at any point, you can put a filter on the Tags column and view only the companies with these tags. Tagging can also be used for more custom processes in your workflow. For instance, if you are an analyst and you need your manager to have a look at a few specific targets to make a final call, you can create a custom tag like “Needs review from manager” that you apply to all of them and then it’ll be easy to filter the table down to just those for a quick review. To add tags, just click in the table cell on the row of interest in the “Tags” column.
Notes
Notes is a handy text field you have available for every company to make any notes you want. These are also filterable so you can add a table filter to find rows with specific notes. To add notes, just click in the table cell on the row of interest in the “Notes” column (see image above).
As you can see, udu Source is a very customizable tool that can fit well into any workflow. If you haven’t tried udu Source yet and want to give it a shot, just reach out and we’d be happy to give you a tour.